
3.5-Minute Read
These last several months have been up and down in many ways. Global public health challenges, domestic social upheaval and adaptation to new workplace realities are now part of the backdrop. Here we take a quick breather to review how the investment markets held up in this remarkable past half-year. While this piece won’t necessarily reflect your own investment experience, it may provide a useful reference point as it summarizes the performance of the world capital markets.
2020 Midyear Market Review
For a detailed look at the numbers and the benchmark assumptions behind them, you may download and review the full presentations, courtesy of Dimensional Fund Advisors, at these links: KWP 2020 Q1 Market Review and KWP 2020 Q2 Market Review. To compare to last year’s results, you may also reference this earlier piece: 2019 Market Review.
Broad Asset Class Summary
For year-to-date 2020, here are the returns for six of the major broad asset classes below.
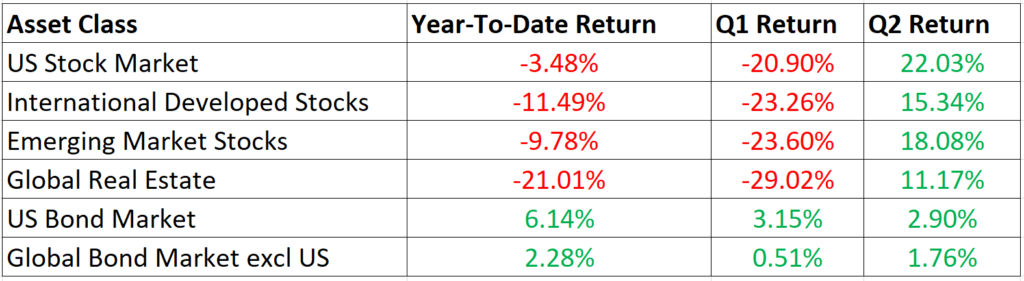
If you glance at the year-to-date figures above, you might only see that it has been a down year so far for equities (stocks) and real estate while it has turned out to be an up year for bonds. But the equity volatility during this short time was extraordinary due largely to the economic contractions from the Coronavirus. You can get a flavor for that by looking at the difference between the Q1 vs Q2 figures in the final two columns.
A Closer Look at Equities
- For equities, the first quarter of 2020 was one of the worst quarters of the past twenty years. For international developed markets, Q1 ended up being the worst quarter since 2001 (surpassing Q4 of 2008). Most of the substantial declines for the entire equity market occurred in March when shutdowns started going into effect across much of the globe. During Q1, the US entered its first recession in over ten years.
- The recovery of equities in the second quarter of 2020 conversely resulted in one of the best quarters of the past twenty years. For the US stock market, Q2 turned out to be the best quarter since 1998 (edging out Q2 of 2009). Albeit still negative, the US outperformed non-US developed and emerging markets in the first half of the year.
- While the full losses of the first quarter were not completely offset for equity investors, those who stayed invested were able likely able to recoup a significant portion of the losses. Global equities ended up down around 7% in the aggregate. A quick math lesson: A 25% decline in an investment requires 33% subsequent gain just to get back to break-even. This is true for price levels but ignores potential dividends.
- Regarding equity characteristics: The value effect was negative in the US, non-US developed markets, and emerging markets. Likewise, Small caps underperformed large caps in the US, non-US developed markets and emerging markets. Notably for Q2 only, small caps did outperform large caps across all markets. A deeper look at the value stocks will be available on this blog next week.
Other Asset Classes
- It has been a particularly tough year for REITS (Real Estate) indices. Returns were below negative 20 percent both inside and outside the US. Clearly one of the harder hit areas due to the Coronavirus.
- Commodities perhaps have had the wildest year of all. The collapse of oil prices in the first quarter was the main culprit. Unleaded gas and WTI crude oil declined by 68.20% and 66.63%, respectively in Q1. Their recoveries in Q2 were +69.46% and +23.43%, respectively. The broader commodities return for the half-year, per the Bloomberg Commodity Index, was -19.40%.
- Bond returns have been positive in 2020 proving to be an effective diversifier against equity risk. That was particularly true for long-term US government bonds. Also, bond yields across the board have continued to decline. Remember there’s an inverse relationship between bond prices and bond yields. Here are the current bond yields across a variety of issues in the US with yields at the end of Q1 in parentheses:
- 10-Year US Treasury: 66% (0.70%)
- State and Local Municipals: 52% (2.87%)
- AAA-AA Corporates: 61% (2.38%)
- A-BBB Corporates: 33% (3.84%)
If you have comments or questions on this piece, please drop me a line at: [email protected]
References
The information on this site is provided “AS IS” and without warranties of any kind either express or implied. To the fullest extent permissible pursuant to applicable laws, Krishna Wealth Planning LLC (referred to as “KWP”) disclaims all warranties, express or implied, including, but not limited to, implied warranties of merchantability, non-infringement, and suitability for a particular purpose.
KWP does not warrant that the information will be free from error. None of the information provided on this website is intended as investment, tax, accounting or legal advice, as an offer or solicitation of an offer to buy or sell, or as an endorsement of any company, security, fund, or other securities or non-securities offering. The information should not be relied upon for purposes of transacting securities or other investments. Your use of the information is at your sole risk. Under no circumstances shall KWP be liable for any direct, indirect, special or consequential damages that result from the use of, or the inability to use, the materials in this site, even if KWP or a KWP authorized representative has been advised of the possibility of such damages.
In no event shall KWP have any liability to you for damages, losses, and causes of action for accessing this site. Information on this website should not be considered a solicitation to buy, an offer to sell, or a recommendation of any security in any jurisdiction where such offer, solicitation, or recommendation would be unlawful or unauthorized.