
4-Minute Read
With the next United States Election only days away, I’ve been sensing both anticipation and a level of fatigue in conversations with families and colleagues. Political uncertainty and a global pandemic turn out to be a potent mix.
Questions often arise about how the financial markets will respond to the outcome of a Presidential race. The goal of this piece is to help you look past the uncertainty of the moment and feel confident you can reach your investment goals regardless of which President is in office.
Setting the Stage with the 2020 Election
Politicians make misleading comments on both sides of the aisle. Ok, understatement of the year. But let me use one fitting comment for the sake of this first argument. In last week’s presidential debate, Donald Trump said: “They say the stock market will boom if I’m elected. If he’s (Joe Biden) elected, the stock market will crash.”
If a similar thought ever entered your mind during election season, don’t worry…you’re human. But you might take some comfort in realizing that this is not how stock market pricing works. Market expectations associated with election outcomes are already embedded in security prices. At the time of this writing, Joe Biden is ahead in the national polls by around 9 percentage points. Granted, elections are often won or lost not directly on the national level but instead on how a few key swing states vote.
So, these national poll results do not mean Biden will be declared the winner, but it does suggest he has a higher likelihood of winning. Should he win, we could also argue it would be a less unexpected event for markets that are forward looking when it comes to setting price levels. Of course, upon learning this year’s election results, the market may decline, or it may not. It just depends on many other factors. It’s the new information that creates real movement in stock prices. The result of an election is one of many inputs the market is taking in.
One thing that may be different about this year’s election compared to those of the recent past is that we may not know the results on election night. Some states will have a larger number of mail-in ballots and it may take time to certify results. If it’s a close and contested election, that could result in short-term uncertainty and volatility in the markets.
All that said, should this impact your long-term investment approach? Let’s examine this from a broader viewpoint. The following charts are courtesy of Dimensional Fund Advisors. We’ll let pictures do most of the talking from here.
Returns During and After Election Years
On average, market returns have been positive in both election years and the subsequent year. Here’s a look at the US market returns going back to 1928.
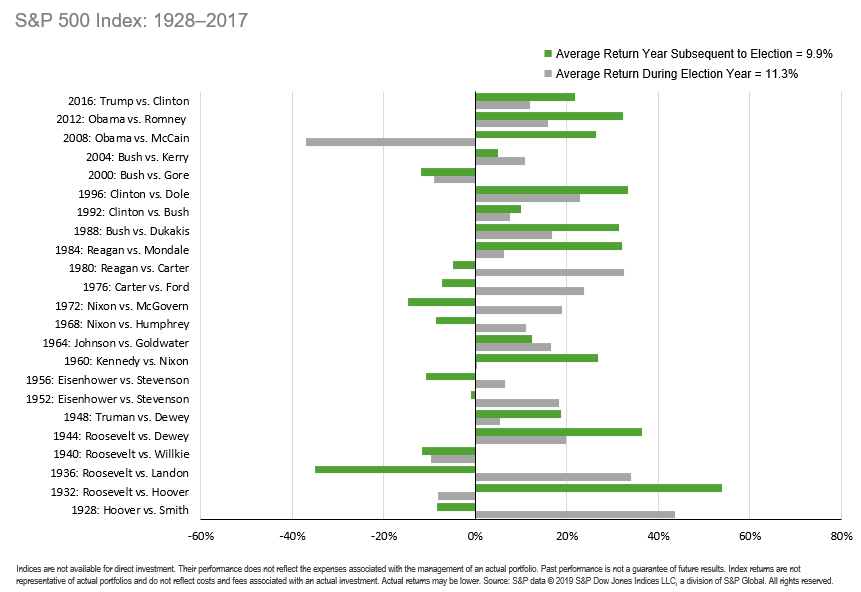
We should remember that a confluence of forces impact market prices. For example, in the graph above, you can see the large negative return (gray bar) in 2008, the year Obama defeated McCain. There were several other events happening that year that could have better explanatory power in the market returns, such as the subprime debt crisis.
Then in the subsequent year of 2009, it became clearer that we were going to work our way out of the debt crisis. The market had a strong positive return (green bar).
Beware of giving any sitting President too much credit or too much blame for what’s happening in the stock market during their term.
Historical Market Returns under a Variety of Presidents
This next chart below also shows more than I can say in words. Fittingly, the Republican President terms are shown in red and the Democratic President terms are shown in blue.
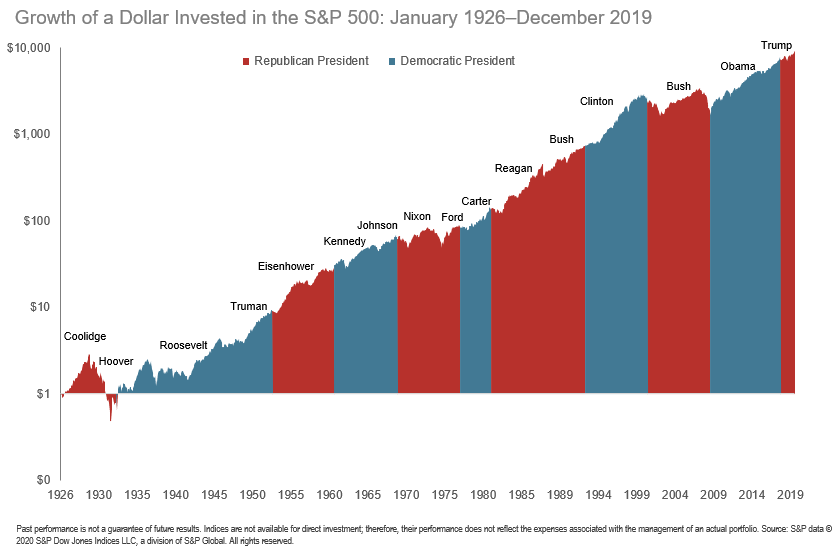
Over nearly 100 years, this shows the productivity of the US markets during the terms of 16 different presidents. If one dollar could have been invested in the S&P 500 over that period, it would have turned into around $9,200.
The takeaway here is that markets have rewarded long-term investors under a variety of presidents.
Presidential Elections and S&P 500 Returns
This final chart isn’t much different than the one above. But it’s in histogram format and it shows returns at the monthly level. The color coding helps show the returns during the month either a Republican or Democratic won the office.
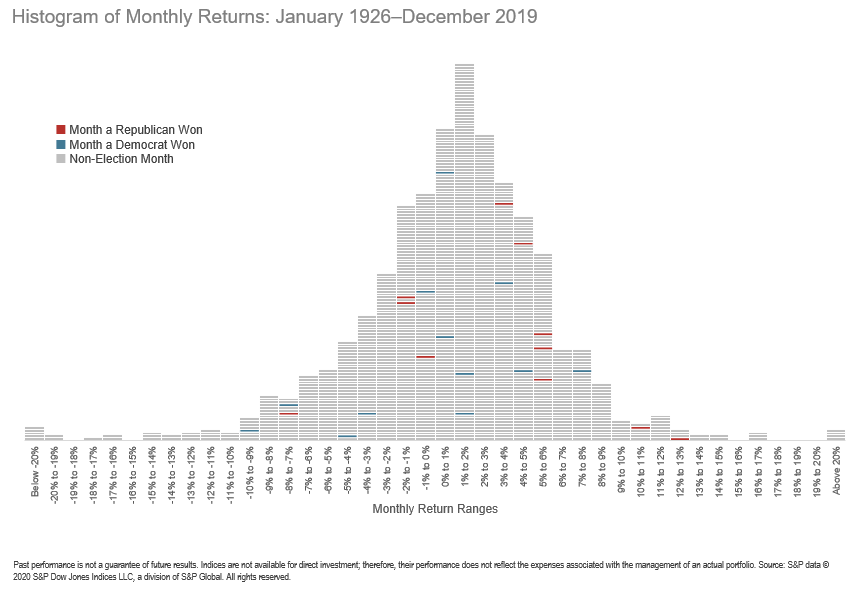
Don’t stare too hard at this one. There’s no pattern to detect here. The returns are randomly distributed. The point is that it is difficult to identify systematic return patterns in election years.
Keep Presidential Power in Perspective
Let’s conclude by noting that while a President has much power, they have limited power over the financial markets. Businesses will continue to operate, find ways to innovate and build the products and services we need.
Presidents can set the tone for corporate taxation and regulation, factors that do indeed impact businesses. However, Presidents have several other hurdles to pass their legislative agendas. They often need control of both the Senate and House of Representatives. Many presidents had only a mixed amount of that control during their terms.
Other factors dictate what a President will be willing and able to accomplish. Just from an economic lens, that includes GDP Growth, the budget deficit, inflation, and the unemployment rate. And lest we forget, we’re in the middle of global pandemic. Along with affecting market returns, this can shape public policy and consciousness for long time to come.
I hope this piece is a good reminder for you to stick with your investment plan regardless of which President is in office or comes into office.
If you have comments or questions on this piece, please drop me a line at: [email protected]
References
- https://www.usnews.com/news/elections/articles/2020-10-22/memorable-quotes-from-the-final-2020-presidential-debate
- https://projects.fivethirtyeight.com/polls/president-general/national/
The information on this site is provided “AS IS” and without warranties of any kind either express or implied. To the fullest extent permissible pursuant to applicable laws, Krishna Wealth Planning LLC (referred to as “KWP”) disclaims all warranties, express or implied, including, but not limited to, implied warranties of merchantability, non-infringement, and suitability for a particular purpose.
KWP does not warrant that the information will be free from error. None of the information provided on this website is intended as investment, tax, accounting or legal advice, as an offer or solicitation of an offer to buy or sell, or as an endorsement of any company, security, fund, or other securities or non-securities offering. The information should not be relied upon for purposes of transacting securities or other investments. Your use of the information is at your sole risk. Under no circumstances shall KWP be liable for any direct, indirect, special or consequential damages that result from the use of, or the inability to use, the materials in this site, even if KWP or a KWP authorized representative has been advised of the possibility of such damages.
In no event shall KWP have any liability to you for damages, losses, and causes of action for accessing this site. Information on this website should not be considered a solicitation to buy, an offer to sell, or a recommendation of any security in any jurisdiction where such offer, solicitation, or recommendation would be unlawful or unauthorized.