
6-Minute Read
At the time of this writing, the second decade of the 21st century is three months away from ending. For many investors, their experience in each of these past two decades has been starkly different. As Dimensional Fund Advisors (DFA) recently wrote in A Tale of Two Decades, it was like Charles Dickens’ famous line “It was the best of times, it was the worst of times…”. While much can be learned looking back at these two decades, one important investment lesson revealed was simply this: Diversification can be our ally in the battle against an unknown future. A closer look shows why.
The “Lost” Decade?
The period between January 2000 and December 2009 is often called the “lost decade” and for good reason. We dealt with the aftermath of both the dotcom bubble and housing related financial crisis. The annualized return of the S&P 500, a common proxy for the broad US stock market, was around negative 0.9%. That means $100,000 invested at the beginning of the period would have ended at roughly $91,300 and that’s before accounting for real-world implementation costs. Comparatively, one-month US Treasury bills, one of the least volatile investments available, returned a positive 2.8% during the same time period. Before costs, that would have turned $100,000 into around $131,800.
You might think an investor should have stayed in Treasury bills or other less volatile assets for that full decade. Perhaps that is true but much of that insight only comes from the benefit of hindsight. Suppose we had an investor willing to take equity risk but who chooses to spread out the risk in a different manner. Let’s look at an example.
Using DFA’s 100% balanced equity strategy (details in table below), the hypothetical return would have been 7.4% during the same “lost” decade. Investors would still have had 20% of their portfolios in the same S&P 500. But they would have been supported by strong returns in other areas of the market like US and international small caps as well as large caps in the overseas international developed and emerging markets. Value stocks outperformed growth stocks during this time too. In unfamiliar, this terminology is explained in this piece by Fidelity.
The “Found” Decade
Forgive investors for forgetting the results from this first decade because the most recent decade (although not technically completed yet) has shown the flip side of the story. The recovery from the great recession has been long and mostly steady. Looking at the first 9 years of this decade (January 2010 to December 2018), we’ve seen the S&P 500 return 11.7%. Growth stocks outperformed value and most international stock benchmarks underperformed their counterparts in the US.
Notably the balanced equity portfolio in our example returned “only” 9.3%. Not bad, but still over a 2% annual lag to the broad US stock market.
The Combined “Lost and Found” Decades (Almost)
When we combine the two decades (or 19 years specifically), the return of the S&P 500 was 4.9% and the return of the balanced strategy was 8.3%. In dollar terms, $100,000 invested at the start of the period would have turned into roughly $248,000 for the S&P 500 and $455,000 for the balanced strategy. That’s a truly whopping difference, but some caveats will be discussed shortly.
Interestingly, the single worst calendar year for both strategies occurred in 2008, but the balanced strategy fared slightly worse that year at -41.8% versus -37.0%. Both strategies had the same number of negative calendar years (five) during this period. It’s important to note investors in either strategy would have experienced high volatility, large up and down price swings, but the balanced approach would appear to have rewarded investors by a substantial margin. There are some caveats to consider and those are described next.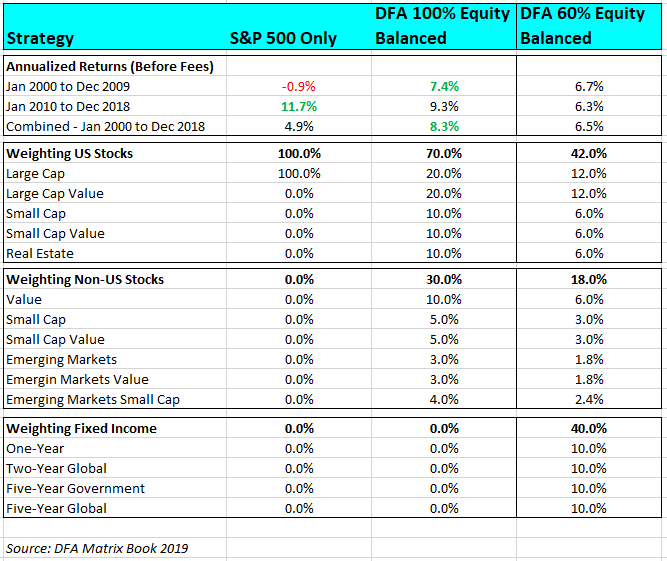
Is this a Fair Comparison?
In fairness to the S&P 500, the balanced strategy described here is hypothetical. These are model results only, and there are limitations to any model. The asset classes are based on indices that are not available for direct investment, but instead must be approximated through exposure in mutual funds. These funds have an operating cost that is passed onto consumers.
The balanced strategy assumes multiple asset classes are used and rebalanced at precisely the same intervals annually. Any rebalancing, or trades in a portfolio, would involve transaction and/or advisory costs that are not factored in the table above.
There is also some “cherry-picking” effect of measuring S&P 500 results from the start of 2000 because the first three years of that decade had negative returns. Notably the previous decade of the 1990s had very attractive returns leading to high valuations that were present around the year 2000.
Still we shouldn’t let the S&P 500 completely off the hook. Many investors are not deciding between two strategies where each is 100% invested in equities. Fixed income, like government and foreign bonds, will be often be included to help manage risk. A balanced strategy where only 60% is allocated to equities (details in table above) still would have outperformed the S&P 500 over the 19-year time period with a 6.5% return. Furthermore, it would have done so with much less volatility.
This comparison has been provided simply for instructional purposes and to show how potentially effective diversification can be over a long period of time. While Krishna Wealth Planning recommends Dimensional Funds for client portfolios, we do not use or advocate any of the specific balanced strategies discussed in this piece.
Concluding Thoughts on Diversification
Experts discuss (and often argue about) the “best” ways to diversify a portfolio in practice. That’s beyond the scope of this piece. But consider that the above-mentioned S&P 500 contains literally 500 of the largest and most productive companies on the planet. Spreading out your investments in those 500 companies should provide a pretty good diversification benefit by itself. Judging only by the last two decades, the question to ponder is whether it provides enough diversification for investors looking to meet their unique financial goals.
When diversifying, we’re attempting to build a portfolio with pieces that are likely to perform differently in different economic environments. If done effectively, it can potentially smoothen out your investment experience. Your short-term returns won’t be as high as the best performing area in the market, but your lows also won’t be low as the worst area. But long-term returns when adjusted for risk can be appealing and can help you more reliably meet future goals.
Investors can and should look at the past for insights, but we do not know what the future has in store. The next set of risks we face will always in the future. By diversifying and maintaining disciplined and patient trading strategy, we can tilt the odds in our favor for having a successful investment experience.
References
- https://us.dimensional.com/perspectives/a-tale-of-two-decades
- https://en.wikipedia.org/wiki/Dot-com_bubble
- https://www.etf.com/sections/swedroe-understanding-financial-crisis?nopaging=1
- https://www.fidelity.com/learning-center/investment-products/mutual-funds/2-schools-growth-vs-value
- Dimensional Matrix Book 2019 – used for all return figures in this piece
The information on this site is provided “AS IS” and without warranties of any kind either express or implied. To the fullest extent permissible pursuant to applicable laws, Krishna Wealth Planning LLC (referred to as “KWP”) disclaims all warranties, express or implied, including, but not limited to, implied warranties of merchantability, non-infringement, and suitability for a particular purpose.
KWP does not warrant that the information will be free from error. None of the information provided on this website is intended as investment, tax, accounting or legal advice, as an offer or solicitation of an offer to buy or sell, or as an endorsement of any company, security, fund, or other securities or non-securities offering. The information should not be relied upon for purposes of transacting securities or other investments. Your use of the information is at your sole risk. Under no circumstances shall KWP be liable for any direct, indirect, special or consequential damages that result from the use of, or the inability to use, the materials in this site, even if KWP or a KWP authorized representative has been advised of the possibility of such damages.
In no event shall KWP have any liability to you for damages, losses, and causes of action for accessing this site. Information on this website should not be considered a solicitation to buy, an offer to sell, or a recommendation of any security in any jurisdiction where such offer, solicitation, or recommendation would be unlawful or unauthorized.