
5-Minute Read
“There is a good chance that the S&P return next year will be between -10% and +30%.”
– Excerpt from ‘Thinking Fast and Slow’
If you tune in to most financial news sources, you will likely hear a reference to the S&P 500. Also known as the Standard and Poor’s 500, it’s a market cap weighted index of the 500 largest, publicly traded companies in the US. It is commonly used to gauge the health of the US stock market and for some investors, the health of their own portfolios. This piece explores the historical performance of the S&P 500 and reveals a few insights you might find surprising.
The Impressive Long-Term Performance of the S&P 500
In an earlier piece, Will Value Investors be Rewarded Again, we explored the Value Premium. Any premium can be defined as the difference in returns between one group of assets and another. As such, the equity risk premium is the difference in returns between the stock market and the risk-free rate of return.
The S&P 500 is sometimes used as a proxy for the US stock market, and one-month Treasury bills (T-bills) can represent the risk-free rate of return. We can then get a fairly good idea of the US equity premium by comparing the two.
In the 94-year period from 1926 to 2019, the S&P 500 had a 10.2% annualized return. If one dollar could have been invested in this (more caveats on that later), it would have turned into $9,237. The real return (after inflation) was 7.1% resulting in the purchasing power equivalent of $643. Still quite impressive.
Over the same time, T-bills had a 3.3% annualized return. One dollar would have turned into $22, but only $1.51 in inflation adjusted terms.
The key point here is that the capital markets have rewarded long-term investors with a return that has more than offset the eroding effects of inflation. But there is a little more to this story.
Annual Observations of the S&P 500
Maybe the previous section was enough to understand the long-term benefits of investing. But we also must remember that realized returns in any given year can vary substantially from long-run expectations.
Consider the illustration below from Dimensional Fund Advisors. During the 94-year period we’re discussing, the S&P 500 had 69 positive years and 25 negative years. So, it was positive around 73% of the time. Note the distribution of those returns is even wider that what this chart shows because it doesn’t show the bars for the very worst and best single year returns.
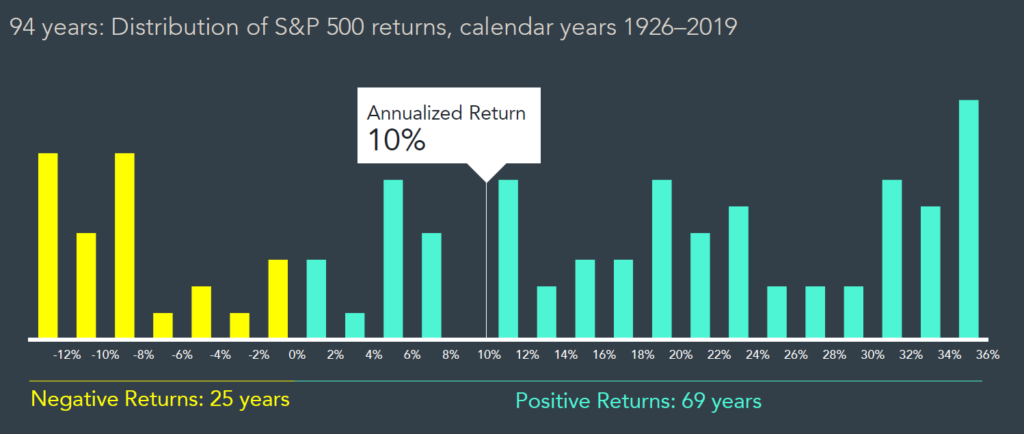
Why I still like this chart is because it shows that while the long-term return of the S&P 500 has been around 10%, there have been exactly 0 observations of returns between 8.0% and 10.0% in any single year. Also, there were only 5 observations between 10.0% and 12.0%.
One way to interpret this: Even if you have a reasonable range of what your average return experience will be in the future, it’s very unlikely you will realize that in any single year. I also find the chart’s result interesting in practice. What I notice when building retirement plans for clients, they typically need an average investment productivity in the 6% to 8% range to comfortably meet their long-term, lifestyle goals. So, it helps to set good expectations for short-term outcomes.
If you were curious about T-bills, they did not register a single negative year during this time. They were also many single years with observations with +/- 1% of the full annualized return of around 3%.
Predicting the Unpredictable
You might be wondering about the quote at the beginning of this piece. It was as taken from Daniel Kahneman’s classic compilation, Thinking Fast and Slow. The joke was that if a CFO of a major company made that kind of statement to colleagues, he or she can expect to be laughed out of the room. But would that be justified?
A comprehensive study was performed by Duke University examining forecasts of 11,600 chief financial officers. The correlation of their estimates and the true value was slightly less than zero. This essentially meant that the forecasts of these highly trained CFOs were worthless!
That part may only be mildly interesting. Perhaps more telling is that the CFOs were so confident in their forecasts. The resulting statistical analysis showed that their so-called “confidence interval” resulted in more than 3 times as many surprise results as there should have been.
I don’t blame the CFOs. They were asked questions and they answered them. Not much stops us humans from making predictions. I used to work with a client who requested (but just for fun) that I share my prediction about the upcoming year’s performance of the S&P 500. I tended to throw out extreme guesses. Some years I looked good, other years I was humbled. In either case it turned out to be randomness of the market at work. I learned that making predictions is fine as long as the stakes are low.
Long Stretches of S&P 500 Underperformance Possible
Famed investor Warren Buffett, who recently turned 90 years old, stated a while back in his estate plan that an S&P 500 index fund be the predominant long-term investment vehicle for his family when he’s gone. Before you rush to follow the Oracle of Omaha’s advice, it’s important to remember that equity risk is real and long stretches of underperformance are possible.
This is not exclusive to the S&P 500 but given that the recent performance of this benchmark has been above average (13.6% from 2010 to 2019), it can be helpful to remember the other outcomes possible.
One example is from 1929 to 1942, the S&P 500 had a return of negative 1.0%. Perhaps not surprising when you realize the Great Depression was on the front end of this 14-year period. A more recent example is 2000 to 2009. Here the S&P 500 returned a negative 0.9% due largely to the unwinding of the tech bubble and the notorious financial crisis of 2008-09. Hence this ten-year period is often called “the lost decade.”
Don’t Forget About Inflation
Since investors care about what they earn after considering the effects of inflation, there are other difficult periods of time in the S&P 500 history. The mid 60s to early 80s stand out.
In the 17-year period from 1966 to 1982, the S&P 500 had a 0% real return. This means during that entire time, you could have been in an equivalent financial position if you invested entirely in T-bills and you wouldn’t have had to deal with some years of significant downside volatility.
Being an equity investor requires a long-time horizon. At least in these past S&P figures, you would have needed 20+ years to have “always’” captured a positive equity risk premium. Put another way, risk premiums are not guaranteed to materialize over the time period you care about. Nevertheless, equity investing has generally proved to be a sound way to protect purchasing power.
Considerations for Investing in the S&P 500
It’s important to remember that the figures in this piece for the S&P 500 represent a benchmark. Any benchmark is not directly investable. You must approximate that by investing in an index fund whose manager’s goal is to achieve results as close as possible (with so-called low tracking error) to the benchmark.
Fortunately, in today’s investing world, there are plenty of mutual fund and ETF solutions that can achieve this with low costs. But this wasn’t always the case. The first S&P 500 index fund wasn’t available until the late 1970s. Now indexing is a much more commonly accepted approach.
Also, we noted how the S&P 500 can exhibit much volatility. This comes with the turf when investing in any assets that have a higher expected return than the risk-free (T-Bill) rate. But diversification can help smoothen your ride. For some illustration on why, you can check out this earlier piece, Two Decades – One Timeless Investment Lesson.
Finally, you don’t really need an S&P 500 fund to capture the benefits (or absorb the risks) described in this piece. The S&P 500 is just one of many US-based investment benchmarks, and the underlying company stocks can be a subset of a variety of different investment solutions available today.
Thank you for reading. Note all the return figures in this piece were courtesy of Dimensional Fund Advisors. If you have comments or questions on this piece, please drop me a line at: [email protected]
References
- https://krishnawealth.com/will-value-investors-be-rewarded-again/
- https://www.amazon.com/Thinking-Fast-Slow-Daniel-Kahneman/dp/0374533555
- https://www.fool.com/investing/2019/09/08/warren-buffetts-investing-plan-for-his-family-why.aspx
- https://finance.yahoo.com/news/first-p-500-index-fund-162906955.html#:~:text=Fast%20forward%20to%20August%2031,of%20the%20S%26P%20500%20index.
- https://krishnawealth.com/two-decades-one-timeless-investment-lesson/
- https://us.dimensional.com/
The information on this site is provided “AS IS” and without warranties of any kind either express or implied. To the fullest extent permissible pursuant to applicable laws, Krishna Wealth Planning LLC (referred to as “KWP”) disclaims all warranties, express or implied, including, but not limited to, implied warranties of merchantability, non-infringement, and suitability for a particular purpose.
KWP does not warrant that the information will be free from error. None of the information provided on this website is intended as investment, tax, accounting or legal advice, as an offer or solicitation of an offer to buy or sell, or as an endorsement of any company, security, fund, or other securities or non-securities offering. The information should not be relied upon for purposes of transacting securities or other investments. Your use of the information is at your sole risk. Under no circumstances shall KWP be liable for any direct, indirect, special or consequential damages that result from the use of, or the inability to use, the materials in this site, even if KWP or a KWP authorized representative has been advised of the possibility of such damages.
In no event shall KWP have any liability to you for damages, losses, and causes of action for accessing this site. Information on this website should not be considered a solicitation to buy, an offer to sell, or a recommendation of any security in any jurisdiction where such offer, solicitation, or recommendation would be unlawful or unauthorized.